


Financial KPIs for Service Businesses: The Numbers That Actually Run Your Business
TL/DR
What this article covers: The financial KPIs that matter most for service businesses at $500K–$2M in revenue — what they measure, how to calculate them, what healthy looks like, and how to build a review cadence that turns numbers into decisions.
Who it's for: Coaches, consultants, agencies, and service firm owners who are past the survival stage but still making major financial decisions by feel rather than by data. If you have revenue but not clarity, this is for you.
The bottom line: Most service business owners are tracking the wrong numbers — or not tracking consistently at all. The goal isn't more data. It's fewer, better metrics reviewed on a rhythm that keeps you ahead of problems instead of reacting to them.
The Problem With "More Data"
Most service business owners don't have a data shortage. They have a signal problem.
QuickBooks produces dozens of reports. Your bank feed updates daily. Your invoicing software tracks every payment. And yet, when it's time to decide whether to hire someone, raise prices, or take on a new client, the answer still feels uncertain.
That's not a technology failure. It's a KPI failure.
A KPI — a Key Performance Indicator — is not just any number in your business. It's a specific metric that tells you whether something critical is moving in the right direction. The word "key" matters. Most businesses track too many numbers and get signal from too few.
For service businesses at $500K–$2M, the financial metrics that matter most fall into four categories: profitability, cash flow, revenue quality, and operational efficiency. You don't need twenty metrics across these categories. You need the right five to seven, reviewed consistently, with clear thresholds that tell you when to act.
This guide gives you that framework.
Why Service Businesses Need Different KPI metrics
Before we get into the metrics, it's worth understanding why service businesses can't just borrow KPI frameworks from product companies or early-stage startups.
Service businesses have a fundamentally different cost structure. Your primary input is human time — yours, your team's, your contractors'. Unlike a product business, you can't stockpile inventory during slow periods or scale production with a factory line. Revenue is capped by capacity. Margin is sensitive to scope creep, underpricing, and utilization.
That means the financial metrics that matter most for you are the ones that track how efficiently you're converting time and expertise into revenue and profit — and how predictably that cash is arriving.
A SaaS founder needs to track monthly recurring revenue, churn rate, and customer acquisition cost. A service business owner at $1.2M needs to track gross profit margin, days sales outstanding, and utilization. Different business model. Different KPIs.
The 7 Financial KPI Every Service Business Should Track
1. Gross Profit Margin
What it measures: How much revenue remains after paying the direct costs of delivering your services.
How to calculate it:
Gross Profit = Revenue − Cost of Goods Sold (direct service delivery costs)
Gross Profit Margin = (Gross Profit ÷ Revenue) × 100
What counts as COGS for a service business: Contractor fees, subcontractor costs, software tools used directly for client delivery, direct labor hours if you track them.
What healthy looks like:
Consulting / coaching: 65–80%
Agencies (with contractors): 45–65%
Done-for-you service firms: 50–70%
Why it matters:Gross profit margin tells you whether your business model is structurally sound. You can be growing revenue and still have a failing business if your margin is deteriorating. If your gross margin is below 40%, you have very little left to cover overhead, pay yourself, and generate profit — regardless of how much you're billing.
Watch for: Margin creep downward over time. If your gross margin was 60% six months ago and is now 52%, something has changed — scope, contractor costs, pricing, or client mix. That shift needs to be diagnosed before it becomes a crisis.
2. Net Profit Margin
What it measures: What percentage of revenue becomes actual profit after all expenses — including overhead, owner salary, and taxes.
How to calculate it:
Net Profit Margin = (Net Profit ÷ Revenue) × 100
What healthy looks like:
Service businesses at $500K–$2M: 15–25% is a strong target
Below 10%: worth investigating — overhead may be too high or pricing too low
Above 30%: possible, but verify you're not underpaying yourself
Why it matters: Net profit margin is the number that tells you how much your business is truly earning — after everyone and everything gets paid, including you. How to read a profit and loss statement walks through exactly where net profit appears and what the surrounding numbers mean.
Owner compensation note: Net profit margin numbers only mean something if your owner compensation is properly accounted for. If you're not paying yourself a market-rate salary and counting that as an expense, your net profit figure is artificially high.
3. Revenue Per Client (and Revenue Concentration)
What it measures: How much revenue each client generates — and how dependent your business is on any single client.
How to calculate it:
Revenue Per Client = Total Revenue ÷ Number of Active Clients
Revenue concentration: What percentage of total revenue comes from your top 1–3 clients?
What healthy looks like:
No single client should represent more than 20–25% of total revenue
If one client is 30%+, that's a concentration risk that belongs in your financial model
Why it matters: Revenue concentration is one of the most undertracked risks in service businesses. If your largest client represents 40% of your revenue and they reduce scope, pause, or leave, your business doesn't just shrink — your cash flow, your team's hours, and your own distributions are all immediately at risk.
4. Days Sales Outstanding (DSO)
What it measures: The average number of days between sending an invoice and receiving payment.
How to calculate it:
DSO = (Accounts Receivable ÷ Total Revenue) × Number of Days in the Period
Example: If you have $45,000 in AR and generated $150,000 in revenue over the last 90 days:
DSO = ($45,000 ÷ $150,000) × 90 = 27 days
What healthy looks like:
Under 30 days: strong collections process
30–45 days: manageable, but monitor closely
45+ days: collections process needs attention — cash flow impact is likely already showing
Why it matters: DSO is where cash flow and operations collide. Every day your DSO rises, cash is sitting in someone else's account that belongs in yours. Tightening payment terms and running a consistent collections playbook can reduce DSO by 10–15 days in a single billing cycle.
5. Cash Runway
What it measures: How many weeks your business can continue operating at current expense levels using available cash — with no new revenue coming in.
How to calculate it:
Cash Runway (weeks) = Current Cash Balance ÷ Average Weekly Operating Expenses
What healthy looks like:
Minimum: 8 weeks (2 months) of runway at all times
Target: 12–16 weeks for service businesses at $500K–$2M
Below 6 weeks: emergency signal — act immediately
Why it matters: Cash runway is your business's financial buffer. Understanding the difference between cash and profit is the foundation here — a profitable business can still run out of runway if cash isn't managed deliberately. Building a 13-week rolling cash flow forecast makes runway visible at all times, which is exactly the point.
6. Utilization Rate (if you have a team)
What it measures: The percentage of your team's available hours that are spent on billable client work.
How to calculate it:
Utilization Rate = (Billable Hours ÷ Total Available Hours) × 100
What healthy looks like:
65–75%: healthy — allows for internal work, development, admin
Above 80%: capacity risk — burnout and quality degradation likely
Below 55%: team is underutilized — evaluate pipeline, scoping, or team size
Why it matters: Utilization is the service business equivalent of inventory turnover. A team running at 45% utilization while the owner is stretched thin is a signal that work isn't being distributed correctly — or that the team isn't fully ramped on delivery.
Solo owner note: Track your own time allocation too. If you're below 50% billable, your revenue ceiling is lower than your capacity would suggest.
7. Client Retention Rate
What it measures: What percentage of clients from one period continue in the next period.
How to calculate it:
Retention Rate = ((Clients at End of Period − New Clients) ÷ Clients at Start of Period) × 100
What healthy looks like:
Retainer-based businesses: 80%+ quarterly retention
Project-based businesses: track repeat engagement rate instead
Churn above 25% per quarter: investigate pricing, delivery quality, or client fit
Why it matters: Retention is the closest thing a service business has to a compounding asset. Every client you keep is revenue you don't have to re-earn through sales. High churn means you're running a business on a treadmill — constantly replacing what you're losing.
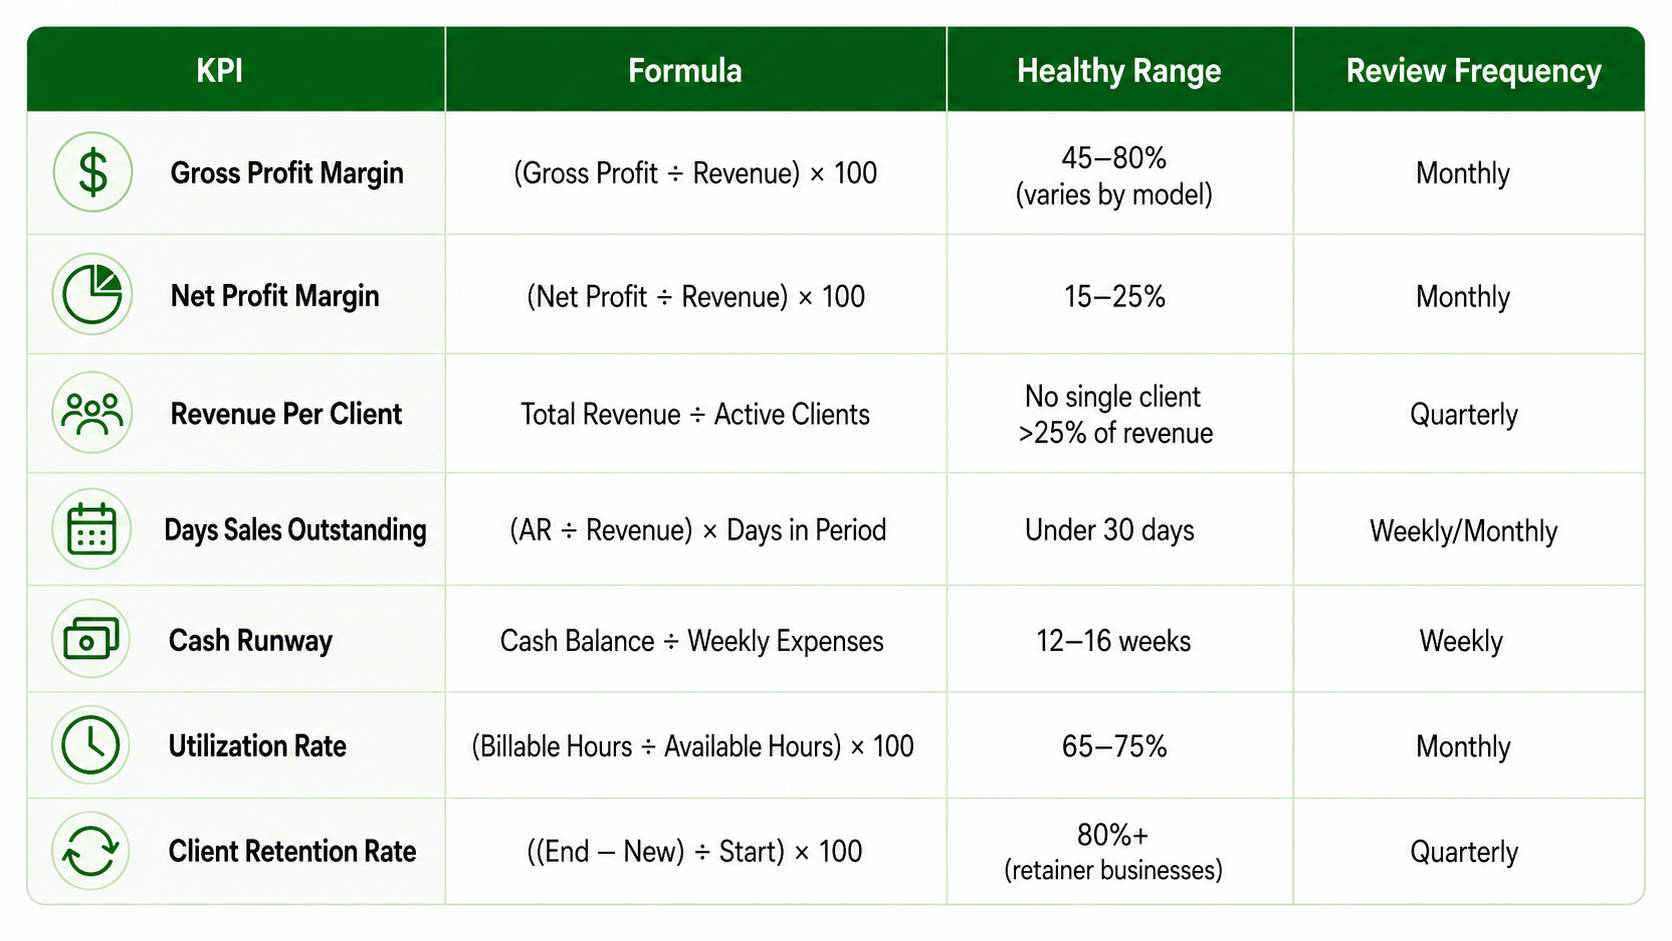
KPI Quick Reference Table
The KPI Review Cadence: When to Look at What
Having the right metrics is only half the equation. The other half is building a rhythm for reviewing them — one that's sustainable and actually produces decisions.
Weekly (15 minutes)
Cash balance vs. prior week
AR aging — any new invoices past due?
DSO trend — is it moving up or down?
Upcoming cash obligations (payroll, contractor payments, subscriptions)
The goal of the weekly review is not analysis. It's awareness. You're looking for anything that needs immediate attention before it becomes a problem.
Monthly (60–90 minutes)
Gross profit margin — vs. prior month and vs. target
Net profit margin — vs. prior month and vs. target
Revenue per client — any significant changes in client mix?
Utilization rate — by team member if applicable
Cash runway — updated based on current balance and expense run rate
New vs. retained clients — what's driving the change?
The monthly review is where the real financial management happens. This is the meeting where you read the story the numbers are telling — not just record the score.
Quarterly (half day)
All monthly KPIs reviewed as a trend (3-month view)
Revenue concentration — has any single client grown to a risk-level percentage?
Client retention rate for the quarter
Gross margin trend — is it improving, stable, or deteriorating?
Annual plan check-in — are you on track for the year?
Pricing review — do your rates still reflect the cost of delivery and the value you're providing?
The quarterly review is where strategy happens. This is when you decide whether to hire, restructure an offer, raise prices, or make a significant investment.
Building Your KPI Dashboard
You don't need sophisticated software to track these KPIs. What you need is consistency.
Minimum viable setup: A spreadsheet with the seven KPIs above, updated monthly, with a 12-month rolling view so you can see trends rather than snapshots. Color-code thresholds — green for healthy, yellow for watch, red for act.
QuickBooks Online: Runs gross profit margin and net profit margin natively in your P&L report. DSO is available in the AR aging report. These two reports alone cover four of your seven KPIs.
What to avoid: Building a complex dashboard that takes two hours to update and falls into disuse within 90 days. The best KPI system is the one you actually review. Start simple.
What a virtual CFO adds here: If you're working with a virtual CFO, the dashboard is typically part of the monthly close package — pre-built, updated, and reviewed together so the numbers connect to decisions rather than sitting in a spreadsheet no one acts on.
A Real-World Example: What KPIs Revealed in 60 Days
A consulting firm at $1.1M in revenue came to me certain their cash flow problem was a collections issue. Clients were slow to pay, and the owner was constantly watching the bank account.
When we built their KPI dashboard for the first time, what we actually found was more nuanced. DSO was 38 days — not ideal, but not the crisis they expected. The real issue was gross margin compression. Eighteen months earlier, their gross margin had been 62%. By the time we looked at it together, it had dropped to 44%.
The cause: two large clients had negotiated deeper discounts on renewal, and contractor costs had increased as the team grew to support them. Revenue was up. Profitability was quietly eroding.
The fix wasn't to chase invoices faster. It was to renegotiate one contract, restructure the contractor model for the other engagement, and establish a gross margin floor of 55% for any new client engagement. Within two quarters, margin was back to 58% and cash flow had stabilized — without adding a single new client.
That's what KPIs actually do. Not measure. Reveal.
Key Takeaways
The goal is fewer, better metrics — not more data. Track the 7 KPIs that matter for your business model and review them on a consistent cadence.
Gross profit margin is your first signal. If it's deteriorating, everything downstream — net profit, distributions, cash flow — is affected.
DSO is where cash flow and operations meet. A 15-day improvement in DSO can meaningfully change your cash position without changing revenue.
Cash runway gives you decision-making power. Without it, every business decision is made under pressure. With it, you have optionality.
Revenue concentration is a hidden risk. If any single client represents more than 25% of revenue, that belongs in your financial model as a scenario.
KPIs only work on a cadence. Weekly awareness, monthly analysis, quarterly strategy — that rhythm is what turns numbers into decisions.
The right KPI system reveals what's actually happening — not just what you assume is happening.
Ready to Build Your KPI Dashboard?
If you've never tracked these metrics consistently, start with gross profit margin and DSO this month. Pull your P&L and AR aging report from QuickBooks and calculate both. That alone will tell you something you didn't know before.
If you want help building a KPI framework tailored to your specific business model and setting up the monthly review cadence, that's exactly the kind of work we do in Virtual CFO Office Hours.
Frequently Asked Questions
What's the difference between a KPI and a regular financial metric?
A financial metric is any number that describes your business — revenue, expenses, invoices sent. A KPI is a metric you've identified as a leading or lagging indicator of something critical to your business health. For a service business at $500K–$2M, that's typically five to seven financial indicators reviewed on a consistent schedule.
How often should I update my KPIs?
Different KPIs have different natural review cycles. Cash balance and AR aging should be reviewed weekly. Gross margin, net margin, and utilization are monthly metrics. Revenue concentration and client retention are best reviewed quarterly. The rhythm matters as much as the metrics themselves: a KPI reviewed inconsistently is just a number.
What if I don't have a team yet — which KPIs apply to a solo service business?
Skip utilization rate as a team metric, but do track your own time allocation. The other six KPIs apply directly: gross margin, net margin, revenue per client, DSO, cash runway, and client retention. For a solo operator, these are especially important because there's no operational buffer — margin compression or cash flow gaps hit the owner immediately.
My gross profit margin is below the healthy range. What should I do first?
Start by understanding why before making changes. Run your P&L by client or by service line to see which engagements are dragging margin down. Common causes: a client being serviced at a higher-than-priced cost due to scope creep, a contractor whose rate has increased since the original pricing, or a service offering that was underpriced from the start. Identify the specific cause before adjusting pricing or restructuring contracts.
How do I track KPIs if I'm not using accounting software?
You need accounting software. QuickBooks Online starts at around $35/month and produces the core reports — P&L, balance sheet, AR aging — that make these KPIs calculable in minutes. Running a service business at $500K+ without accounting software means you're making major financial decisions without the data to support them.
What's a realistic timeline for improving KPIs like DSO or gross margin?
DSO can often be improved within one to two billing cycles by tightening payment terms, adding payment links to invoices, and implementing a consistent follow-up sequence. Gross margin improvement depends on the cause — pricing changes take effect immediately on new engagements, but the full impact on margin shows up over one to two quarters as the client mix shifts.
Can I track these KPIs without a virtual CFO?
Yes — and many business owners at $500K do. The KPIs in this guide can be calculated from QuickBooks reports and tracked in a spreadsheet. What a virtual CFO adds is the interpretation layer: understanding what the numbers are telling you, connecting them to operational decisions, and building the forward-looking model that takes you from reactive to proactive. The metrics are accessible to anyone. The strategy built on top of them is where the engagement earns its value.
About the author: Katishia Gallishaw is a Virtual CFO serving service businesses at $500K–$2M in revenue. She helps owners build the financial systems — forecasting, reporting, and cash flow strategy — that create stability and fund growth without the constant uncertainty.